| |
Code generation
No matter how formal is the model, code can be generated.
Code generation is available for the whole system or for a sub-part
of it such as a class, a block, or a task. Generated code is legible because it is not instrumented.
The code generation process can be customized
to fit the target development environment. Template integrations with the most popular operating systems are provided
in the standard distribution. Graphical debugging at model level on host and target is also possible with
the built-in debugger and cross-debugger integrations. Graphical traces are available in
debug mode as well as in release mode.
Supported RTOS and debugger
Templates for the following RTOS comes with the tool in source code:
The generated code is fully documented and any proprietary RTOS or scheduler can be integrated.
A scheduler also comes with the code generator so that whole or part of the system can be mapped on a task. Integration on a bare
target without any RTOS is therefore possible.
Simulation or debug on target can be done graphically in the model or in the generated source code.
To do so Real Time Developer Studio provides integrations with native and cross debuggers such as:
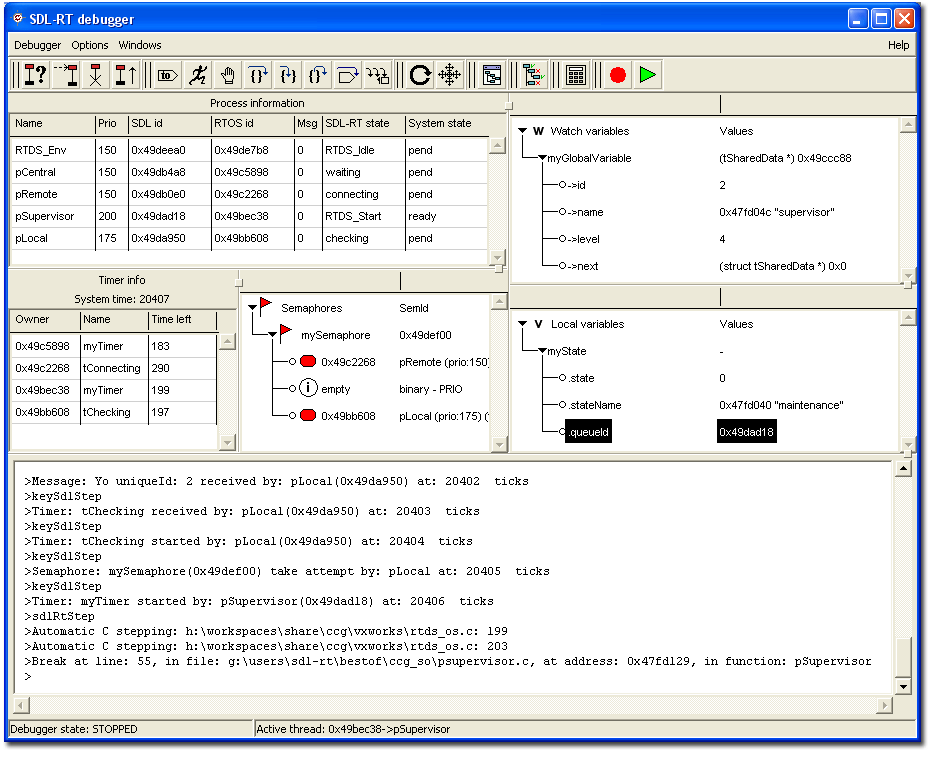
Debugger GUI
To offer graphical debugging, the tool uses a C debugging environment in the background. RTOS system calls are already
integrated in the generated code and to start the debugger is as simple as a mouse click.
The debugger displays key internal information such as :
- List of tasks with their priority, message queue
address, number of messages in the message queue,
internal state, RTOS task state,
- List of active timers with time left and name of
the task that started it,
- List of semaphores with their state and list of blocked
tasks,
- Watch window to follow global variables evolution,
- Local variables in the current stack frame automatically
updated when stepping,
- Shell providing text trace of key events and
direct access to gdb.

Model debugger shows all relevant internal information
|
|
Control execution
The model debugger provides execution traces, as well as three levels of stepping through the model:
- Step from one key event to another key event such as:
- Sending a message
- Receiving a message
- Changing state
- Taking or releasing a semaphore
- Creating a new task
- Manipulating a timer
- Step graphically in the diagrams
- Step in the generated C code
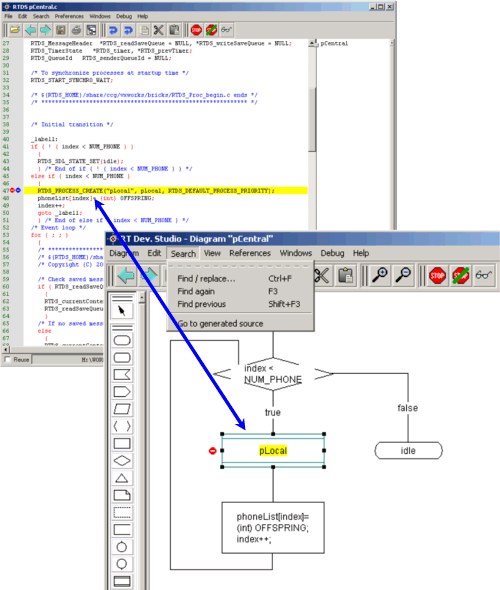
It is possible to step graphically in the model or in the generated C code and to switch from one
representation to the other:

Switch back and forth from the model to the generated code.
A live execution trace can be generated to visually monitor the system under test:

Execution trace on target
|
|


