Heatmaps
This new version allows to connect a heatmap to the model in order to graphically display some quantitative information with colors. The heatmap file format is XML based and refers to the different symbols in the model. For each symbol a value is associated as well as a text. The whole diagram has a "minimum color" and a "maximum color". The rule to calculate the color for each value is configurable. The text associated to each symbol will be displayed in a tool tip in the BPMN editor.Heatmap files can be imported in the project.

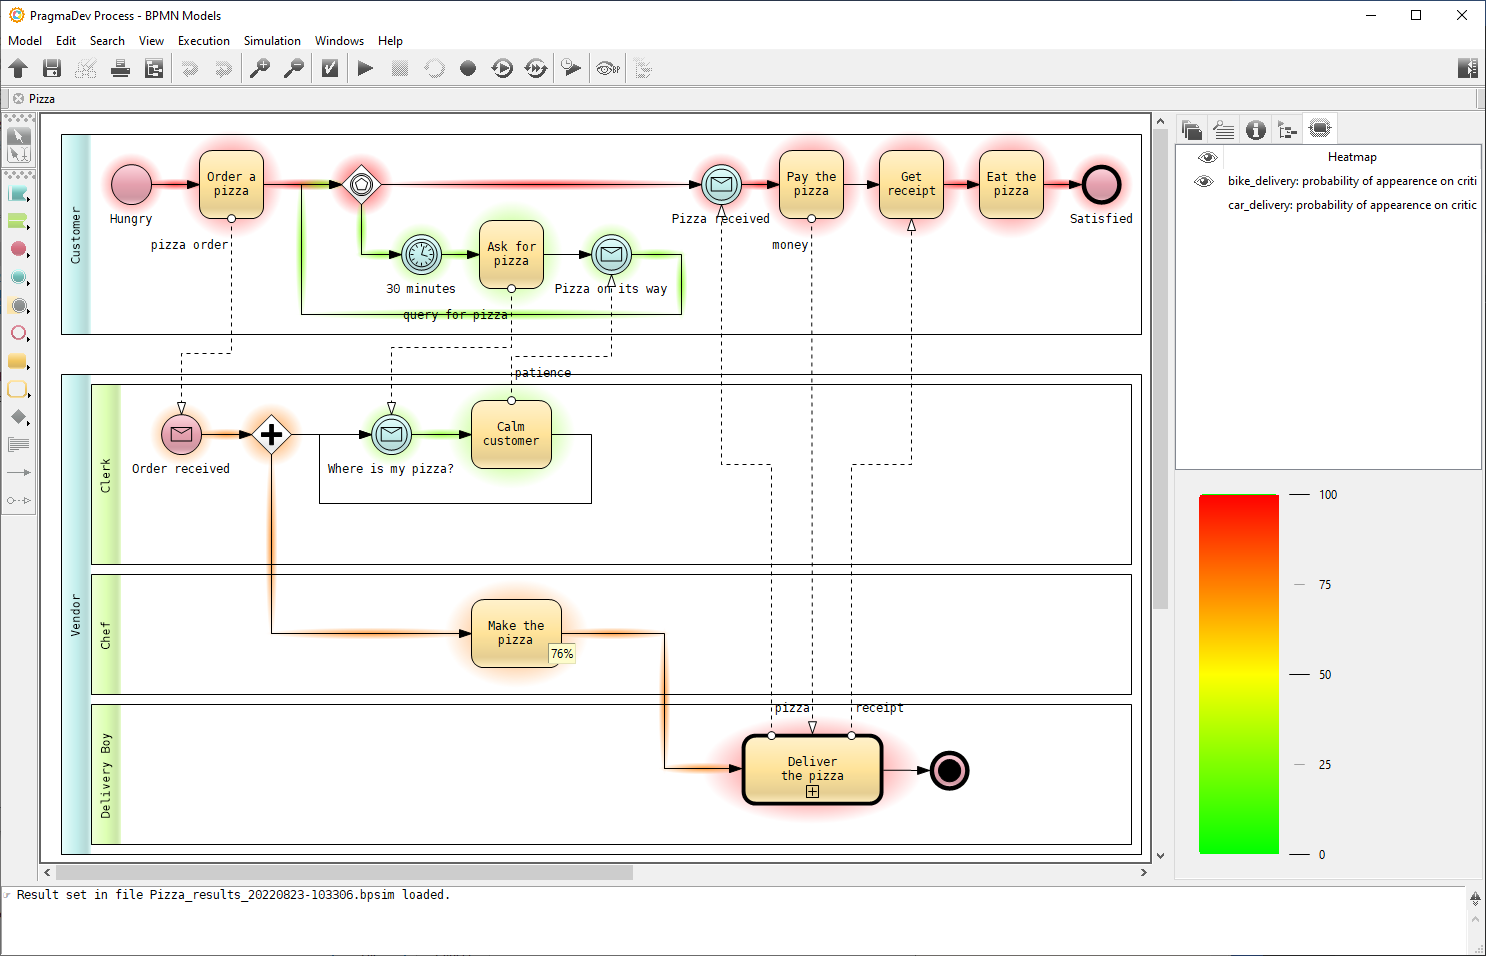
In the BPMN editor a new heatmap tab has been added to the right information panel. The user selects the heatmap to be displayed on the model.

A tool tip is associated to each halo.

Critical path
Principle
In a business process the critical path is the sequence of activities that led to the actual overall execution time with the least inactivity. The link from one activity to another can be a sequence flow, a message flow, a signal or a timer. The analysis of the critical path starts from the ending symbol. For each activity it finds the previous activity in terms of execution time. Each replication of a simulation has a different critical path. At the end of the simulation each activity has an associated percentage representing how statistically critical it is.Configuration
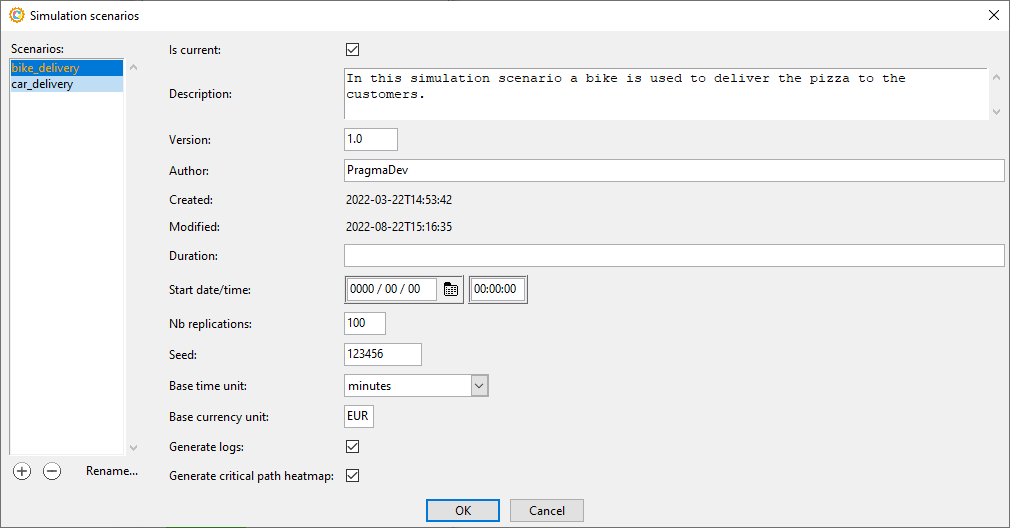
In the Simulation scenarios window the Generate critical path heat map checkbox will activate the critical path analysis during the simulation.

Display
To display the critical path graphically as a heat map, open the simulation results and a specific diagram. Click on the heat map tab on the right of the window and select the desired scenario.

The color scale is displayed at the bottom right of the window. Each symbol has a colored halo associated to its statistical value. A tool tip, when pointing to a halo, will show the exact value for the symbol.


