PragmaDev Process includes a powerful simulator that aims at optimizing business processes and helping stakeholders to trade off between different options.
Optimizing resources in a business process
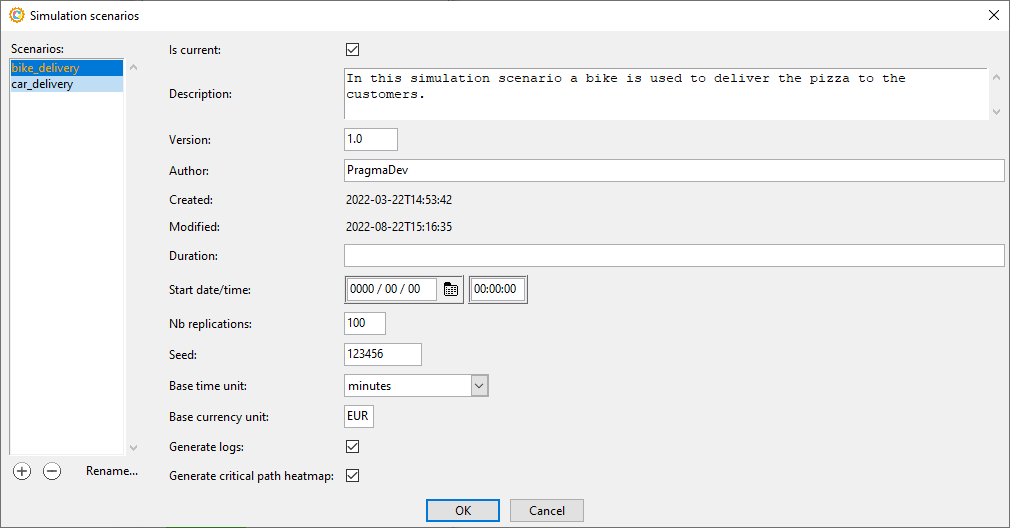
The user defines the inputs in one file and the simulator will generate the output in a separate file for each simulation.
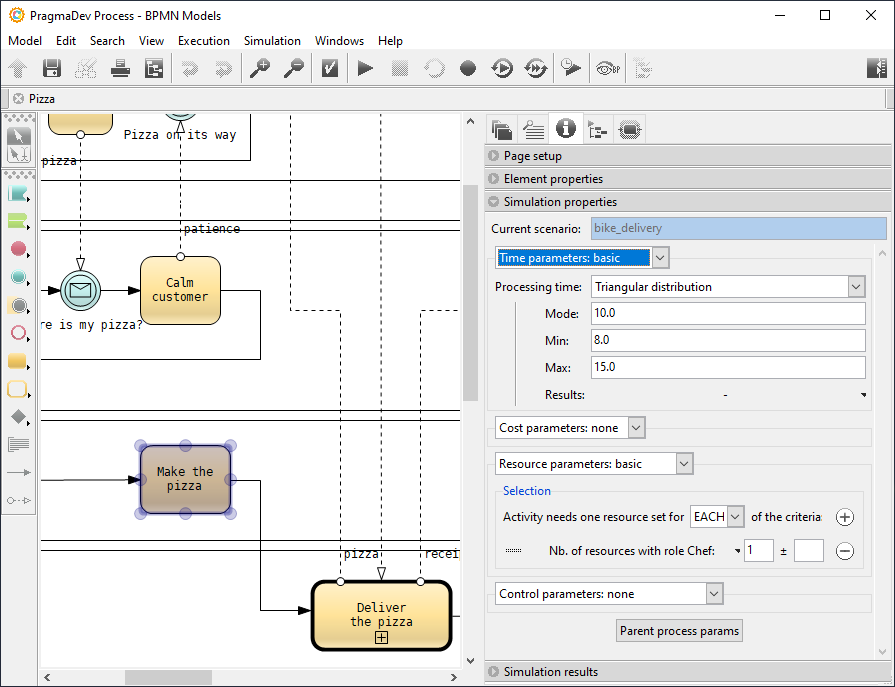
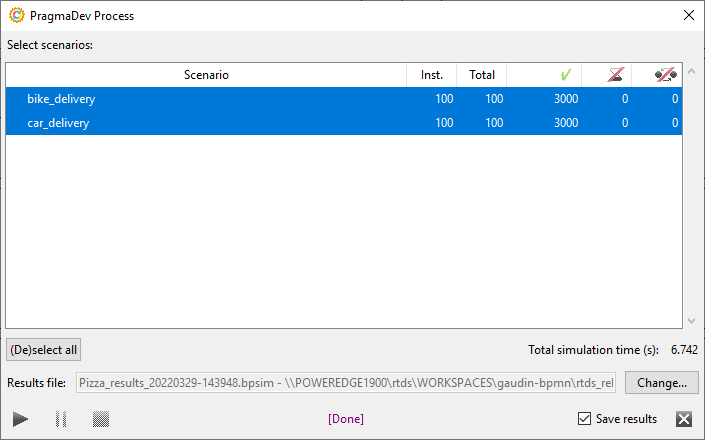
Statistical time and cost information is added to the BPMN model following the BPSim de facto standard. The process simulator runs the different scenarios automatically and produces an evaluation of the time and cost for each process or part of a process. Our simulator is based on our executor and for that reason it is the only one on the market that follows the semantic of BPMN. Check our PragmaDev Process BPMN Simulation with BPSim demo with no resource management, or how to optimize resources in a businnes process demo:
Optimizing resources in a business process
Developed with real industrial use cases, the simulator is fully operational and optimized.
Scenarios
Based on BPSim organisation, a scenario contains the following information:- Time and cost information for each BPMN symbol,
- Probability of execution for branches in a gateway,
- Number of runs and units,
- Expected results.

Resources
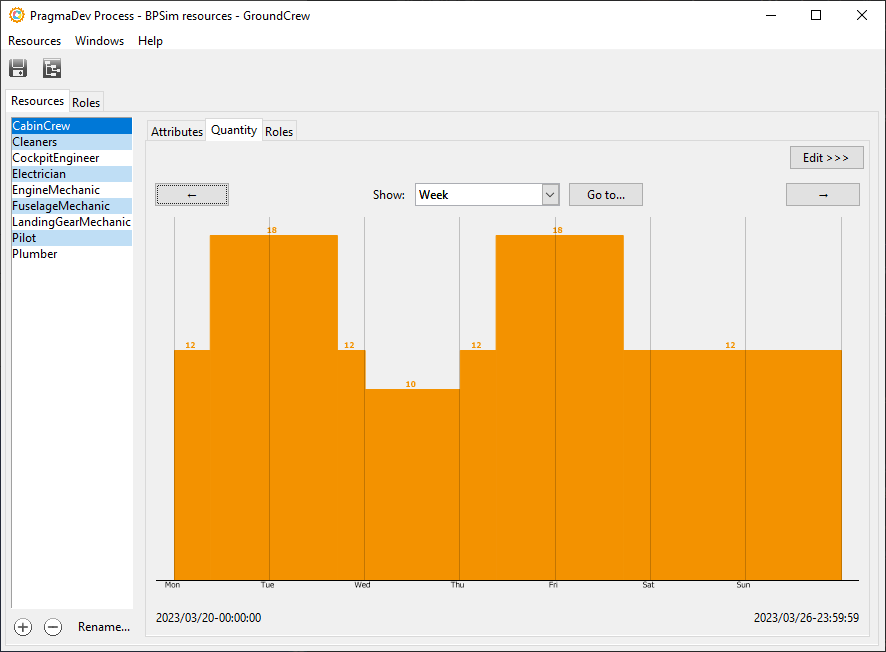
Define the resources in your organization as well as their availability in a calendar. Each resource can have a role (that can be common to another resource) and a performance factor and a cost factor (some resources are faster than others and are more or less expansive).
Time and cost
In the active scenario, the time and cost information is defined for each BPMN symbol in the model. BPSim defines a wide range of possibilities from a fixed value to several distributions for time, as well as fixed and variable information for cost. A resource can also be required, by name or by role, to achieve the activity. If the resource is unavailable the waiting time is added to the process execution.
Output definition
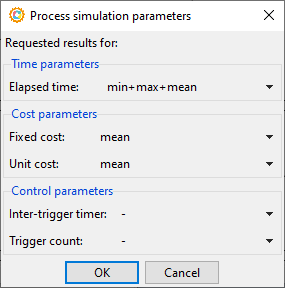
The expected output of the simulation must be defined.
Simulation
Select the scenarios to start the simulation.
Free download
Free download and trial of PragmaDev Process, no license required.Simulation results
Time
Simulation results are available for each symbol that have been targeted in the scenario. In the case of several scenarios all simulation results are presented on the same graph. The best scenario appears clearly.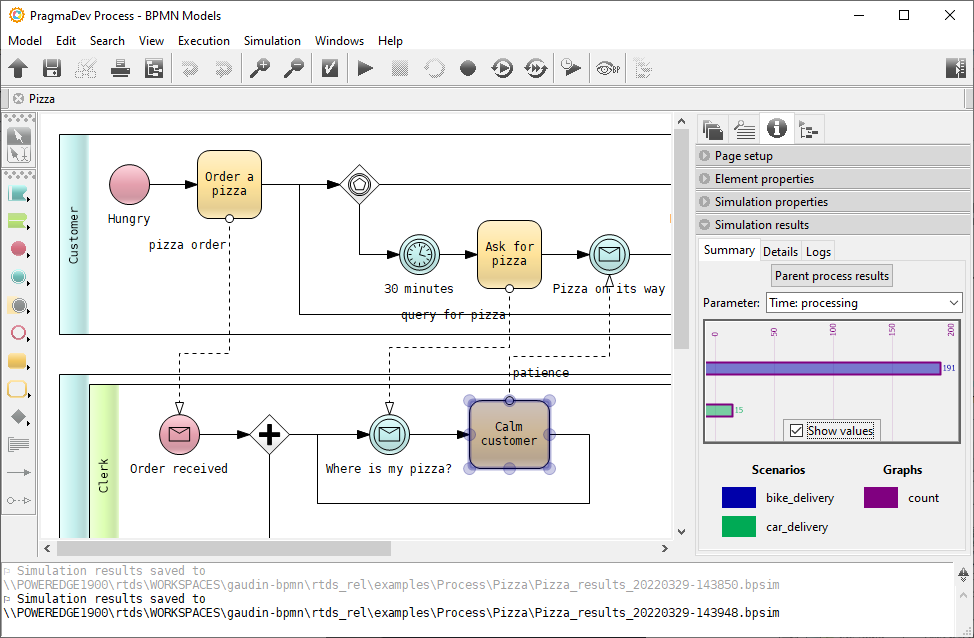
Logs
Each replication during the simulation is logged with all the basic information for a broad analysis.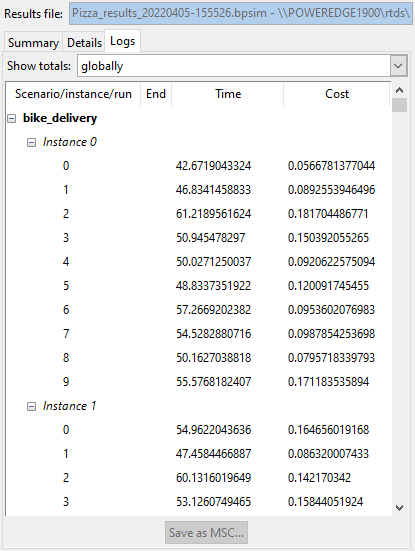
Resource usage
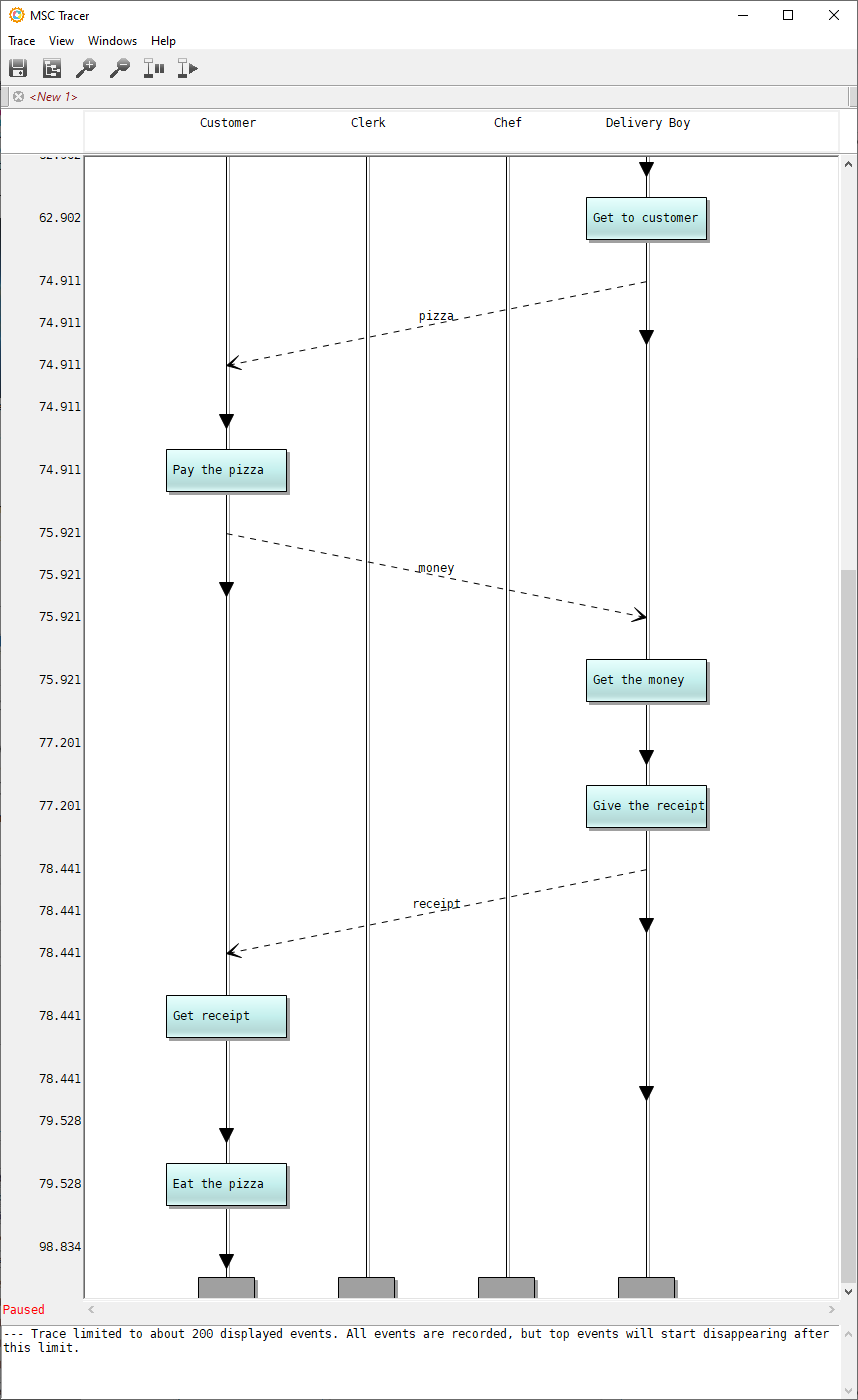
The resource usage during the simulation can be analyzed for the purpose of optimisation.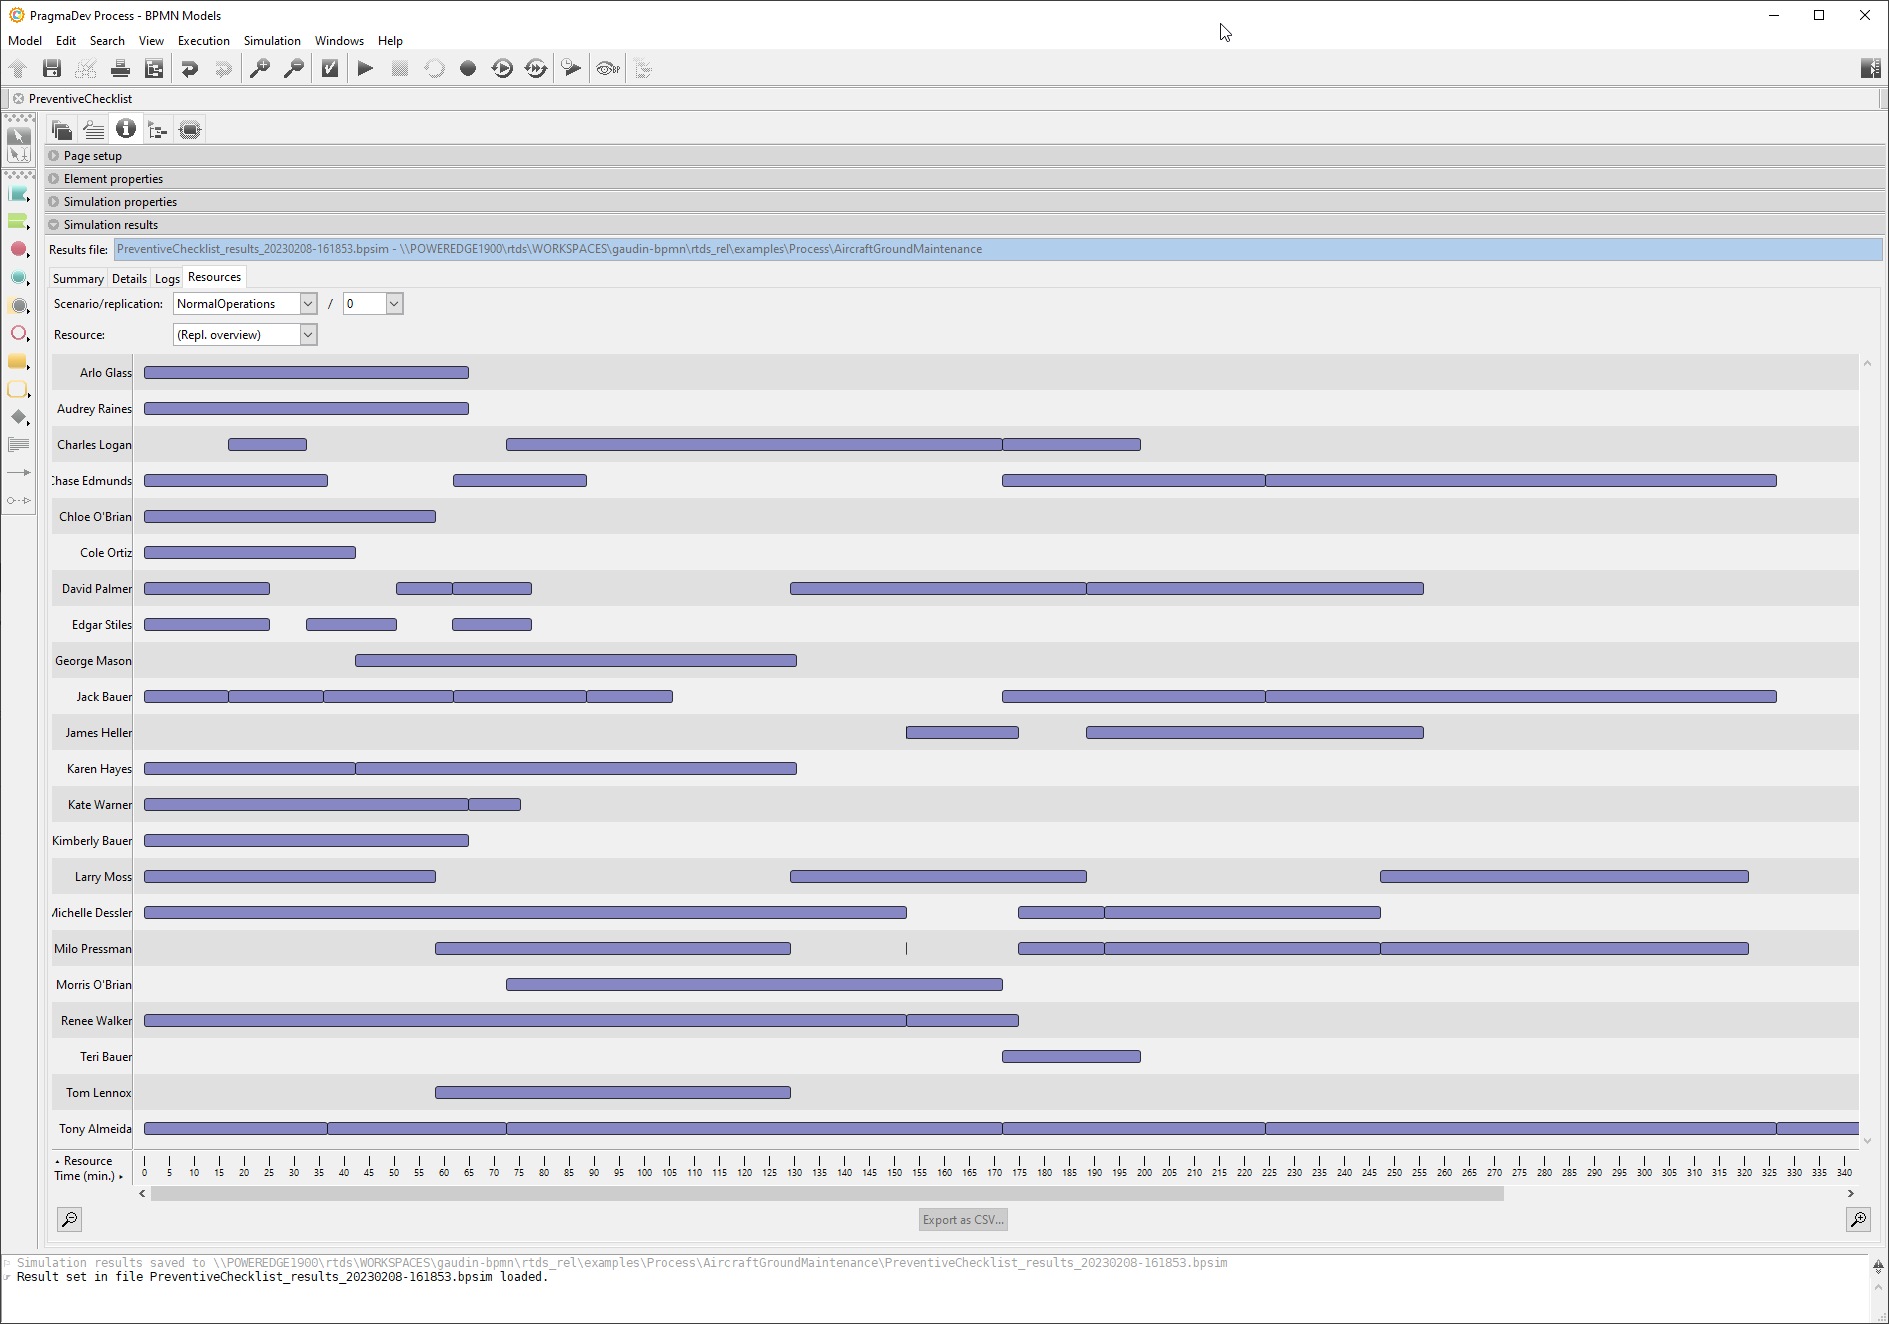
Critical path
The critical path is calculated for each execution. At the end of the simulation critical path statistics for each symbol is displayed graphically.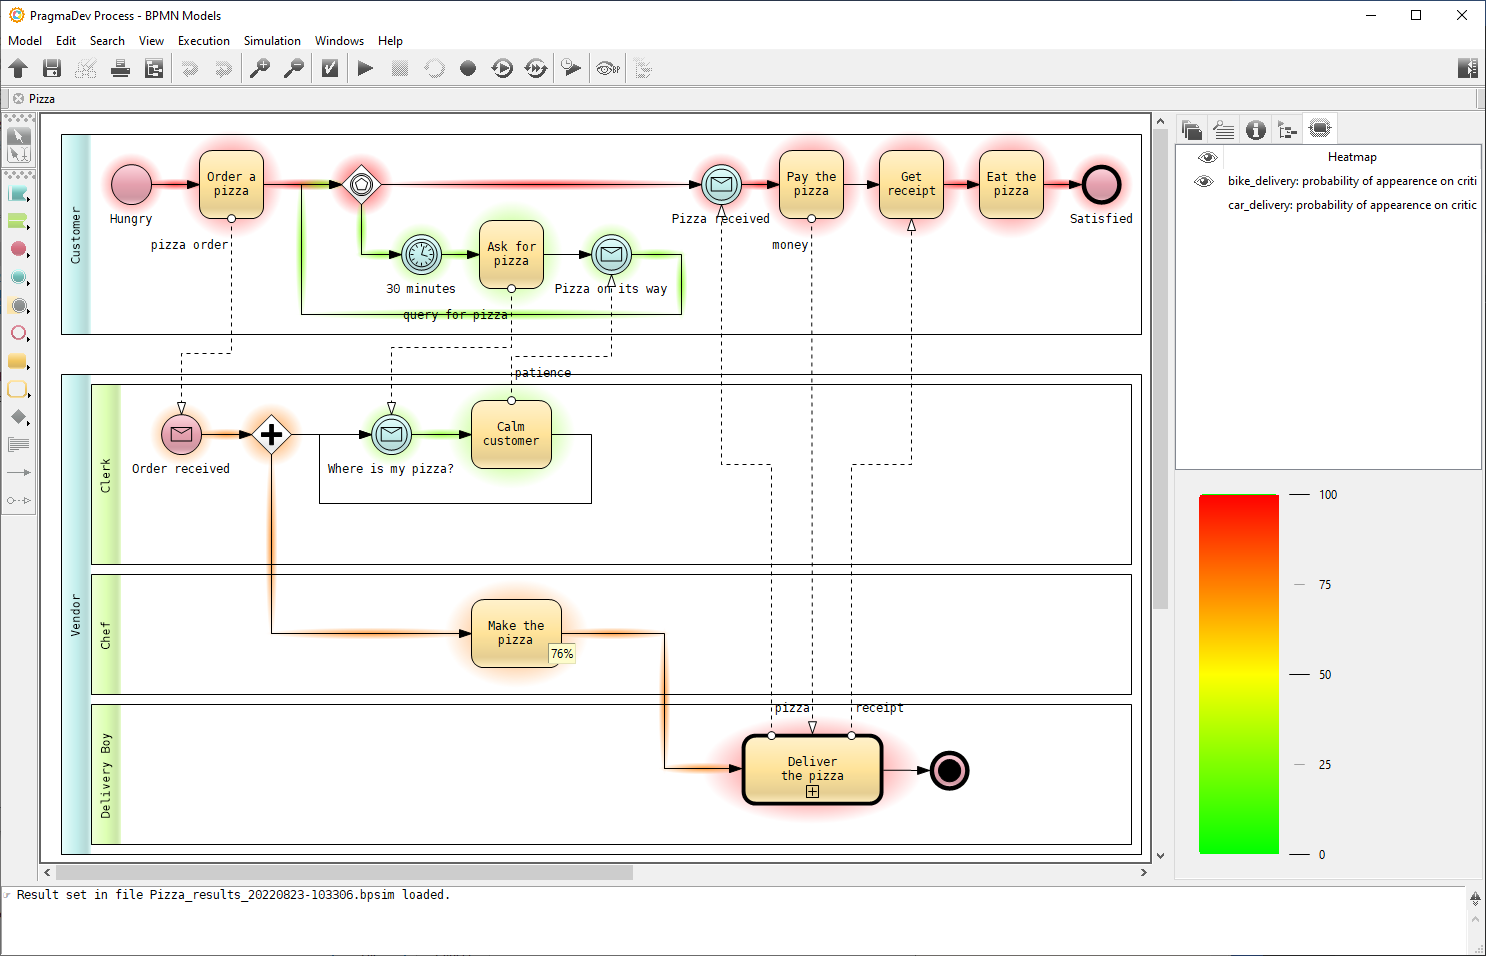
Export
All results can be exported for documentation or further processing.


